
Quanergy Systems
Founded Year
2012Stage
PIPE | IPOTotal Raised
$183.76MAbout Quanergy Systems
Quanergy Systems (NYSE: QNGY) is a technology company developing smart sensing solutions for real-time 3D mapping and object detection, tracking, and classification. Through Quanergy’s smart LiDAR solutions, businesses can leverage real-time, advanced 3D insights to transform their operations in a variety of industries, including industrial automation, physical security, smart cities, smart spaces, and more. Quanergy Systems was founded in 2012 and is based in Sunnyvale, California.
Missing: Quanergy Systems's Product Demo & Case Studies
Promote your product offering to tech buyers.
Reach 1000s of buyers who use CB Insights to identify vendors, demo products, and make purchasing decisions.
Missing: Quanergy Systems's Product & Differentiators
Don’t let your products get skipped. Buyers use our vendor rankings to shortlist companies and drive requests for proposals (RFPs).
Research containing Quanergy Systems
Get data-driven expert analysis from the CB Insights Intelligence Unit.
CB Insights Intelligence Analysts have mentioned Quanergy Systems in 2 CB Insights research briefs, most recently on Apr 6, 2021.
Apr 6, 2021
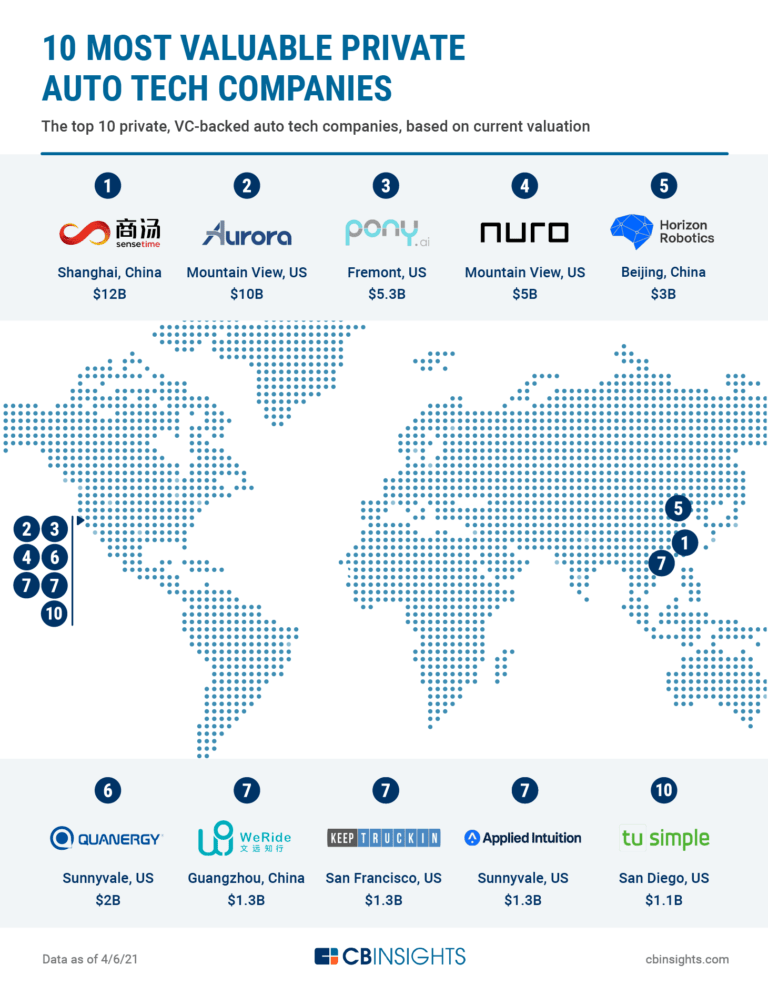
The 10 Most Valuable Private Auto Tech CompaniesDec 16, 2020
40+ Corporations Working On Autonomous VehiclesExpert Collections containing Quanergy Systems
Expert Collections are analyst-curated lists that highlight the companies you need to know in the most important technology spaces.
Quanergy Systems is included in 5 Expert Collections, including Auto Tech.
Auto Tech
2,409 items
Startups building a next-generation mobility ecosystem, using technology to improve connectivity, safety, convenience, and efficiency in vehicles.Includes technologies such as ADAS and autonomous driving, connected vehicles, fleet telematics, V2V/V2X, and vehicle cybersecurity.
Smart Cities
4,534 items
Conference Exhibitors
6,062 items
Companies that will be exhibiting at CES 2018
Tech IPO Pipeline
286 items
Semiconductors, Chips, and Advanced Electronics
6,321 items
Companies in this collection develop everything from microprocessors to flash memory, integrated circuits specifically for quantum computing and artificial intelligence to OLED for displays, massive production fabs to circuit design firms, and everything in between.
Quanergy Systems Patents
Quanergy Systems has filed 17 patents.
The 3 most popular patent topics include:
- Antennas (radio)
- Andromeda (constellation)
- Cetus (constellation)
Application Date | Grant Date | Title | Related Topics | Status |
|---|---|---|---|---|
10/11/2018 | 12/28/2021 | Radio frequency antenna types, Computer memory, Antennas (radio), Holography, Broadcast engineering | Grant |
Application Date | 10/11/2018 |
|---|---|
Grant Date | 12/28/2021 |
Title | |
Related Topics | Radio frequency antenna types, Computer memory, Antennas (radio), Holography, Broadcast engineering |
Status | Grant |
Latest Quanergy Systems News
May 1, 2023
News provided by Share this article Share this article NEW YORK, May 1, 2023 /PRNewswire/ -- The global LiDAR market size is estimated to increase by USD 4,289.97 million from 2022 to 2027. The market's growth momentum will progress at a CAGR of 24.45% during the forecast period. Discover some insights on market size, historic period (2017 to 2021), and Forecast (2023 to 2027) before buying the full report - Request a sample report Lidar market – Vendor Analysis Vendor Landscape - The global lidar market is fragmented, with the presence of several global as well as regional vendors. A few prominent vendors that offer lidar in the market are DENSO Corp., FARO Technologies Inc., GMR Infrastructure Ltd., Hexagon AB, Innoviz Technologies Ltd., LeddarTech Inc., Luminar Technologies Inc., Ouster Inc., Phoenix LiDAR Systems, Quanergy Systems Inc., RIEGL Laser Measurement Systems GmbH, Robert Bosch GmbH, RoboSense, SICK AG, SureStar, Teledyne Technologies Inc., Trimble Inc., Valeo SA, YellowScan, and Zephir Ltd. and others. What's New? - Special coverage on the Russia-Ukraine war; global inflation; recovery analysis from COVID-19; supply chain disruptions, global trade tensions; and risk of recession Global competitiveness and key competitor positions Market presence across multiple geographical footprints - Strong/Active/Niche/Trivial - Buy the report! Vendor Offerings - DENSO Corp. - The company offers Frequency Modulated Continuous Wave or FMCW LiDAR in collaboration with Aeva Inc. FARO Technologies Inc. - The company offers LiDAR technology through laser scanners and SCENE software. Hexagon AB - The company offers LiDAR technology such as Leica TerrainMapper 2 and Sigma Space SPL100. LiDAR Market - Segmentation Assessment Segment Overview This light detection and ranging (LiDAR) market report extensively covers market segmentation by product (airborne LiDAR and terrestrial LiDAR), application (corridor mapping, engineering, Adas and driverless cars, environment, and others), and geography (North America, Europe, APAC, Middle East and Africa, and South America). The market share growth by the airborne LiDAR segment will be significant for market growth during the forecast period. The segment of the market includes LiDAR sensors installed on aircraft and unmanned aerial vehicles (UAVs). Airborne light detection and ranging (LiDAR) sensors are increasingly being used in a variety of applications. The applications include disaster management and defense operations related to national security issues. Hence, the LiDAR market is expected to witness significant growth during the forecast period owing to increasing efforts to deploy aerial LiDAR systems to ensure aircraft safety in commercial aviation. Geography Overview By geography, the global lidar market is segmented into North America, Europe, APAC, Middle East and Africa, and South America. The report provides actionable insights and estimates the contribution of all regions to the growth of the global LiDAR market. North America is estimated to account for 39% of the global market growth during the forecast period. The US contributes a large share of the market revenue in the region. LiDAR solutions are primarily used for mapping applications in areas where accurate topographic maps do not exist and are also used for disaster management and mapping of ground displacements caused by earthquakes, landslides, and storms. Moreover, LiDAR solutions are being used for archaeological surveys throughout the region. Also, LiDAR sensors are widely used in automotive applications, in addition to geospatial mapping and disaster management applications. For some key insights on global, regional, and country-level parameters with growth opportunities from 2017 to 2027 - Download a Sample Report LiDAR Market – Market Dynamics Leading Drivers - Expanding applications of LiDAR technology is a major driver for the LiDAR market during the forecast period. Light detection and ranging (LiDAR) technology is gaining momentum in construction and engineering, and it offers several benefits to the construction and engineering industry, including improved team productivity and process efficiency, and accurate project cost estimates. Point cloud data software can be used to estimate project costs when surveying construction sites using LiDAR technology. Moreover, LiDAR technology can be used to determine the need for maintenance and repair of machinery and equipment in the field. Hence, the introduction of such application-specific LiDAR solutions is expected to propel the market during the forecast period. Key Trends - The development of LiDAR sensors based on continuous-wave frequency modulation (CWFM) technology is an emerging LiDAR market trend during the forecast period. Measurement of time and distance is one area of design improvement for LiDAR sensor manufacturers. Most LiDAR sensors today use a simple time-of-flight approach for time and distance measurement, and they emit short pulses and use a precise clock to measure the time it takes for the laser beam to bounce off them. But the next generation of LiDAR sensor makers is working on continuous wave frequency modulation (CWFM) technology for LiDAR sensors. The original laser beam has a higher frequency and the two beams travel different distances and so when the first beam recombines with the second beam, they are at different frequencies. Hence, such trends influence the market growth for LiDAR during the forecast period. Major challenges - The high cost of LiDAR sensors challenges the growth of the LiDAR market during the forecast period. For instance, the price of a single Velodyne HDL-64 LiDAR sensor is around USD 75,000. LiDAR sensors have seen their costs drop rapidly in recent years. But even this price poses a challenge for the LiDAR market globally as it is too expensive for mass adoption in various industries. Data-based evidence shows that mass production is likely to significantly reduce the cost of LiDAR sensors. This is confirmed by multiple vendors such as Quanergy Systems Inc., Osram, and Velodyne LiDAR Inc. The market vendors have announced plans to reduce the cost of LiDAR sensors used in various industries. Hence, such challenges impede the market growth during the forecast period. Driver, Trend & Challenges state about consequences & sustainability of the businesses, find some insights from a sample report! What are the key data covered in this LiDAR Market report? CAGR of the market during the forecast period Detailed information on factors that will drive the growth of the LiDAR Market between 2023 and 2027 Precise estimation of the size of the LiDAR Market size and its contribution to the market in focus on the parent market Accurate predictions about upcoming trends and changes in consumer behavior Growth of the LiDAR Market industry across North America, Europe, APAC, Middle East and Africa, and South America A thorough analysis of the market's competitive landscape and detailed information about vendors Comprehensive analysis of factors that will challenge the growth of LiDAR Market vendors Gain instant access to 17,000+ market research reports covering 800 technologies across 50 countries. . Related Reports: The light vehicle batteries market size is expected to increase by USD 34.06 billion from 2021 to 2026, and the market's growth momentum will accelerate at a CAGR of 12.72%. Furthermore, this report extensively covers light vehicle batteries market segmentation by application (ICEV and EV) and geography (APAC, Europe, North America, South America, and Middle East and Africa). The stringent regulations on GHG emissions from automobiles is one of the key drivers supporting the light vehicle batteries market growth. The ground penetrating radar market size is expected to increase to USD 171.52 million from 2021 to 2026, and the market's growth momentum will accelerate at a CAGR of 6.63%. Furthermore, this report extensively covers ground penetrating radar market segmentation by application and geography.The rise in concerns related to safety and protection of underground utilities is notably driving the ground penetrating radar market growth. LiDAR Market Scope Exhibit 14: Chart on Global - Market size and forecast 2022-2027 ($ million) Exhibit 15: Data Table on Global - Market size and forecast 2022-2027 ($ million) Exhibit 16: Chart on Global Market: Year-over-year growth 2022-2027 (%) Exhibit 17: Data Table on Global Market: Year-over-year growth 2022-2027 (%) 4 Historic Market Size Exhibit 18: Historic Market Size – Data Table on Global LiDAR market 2017 - 2021 ($ million) 4.2 Product Segment Analysis 2017 - 2021 Exhibit 19: Historic Market Size – Product Segment 2017 - 2021 ($ million) 4.3 Application Segment Analysis 2017 - 2021 Exhibit 20: Historic Market Size – Application Segment 2017 - 2021 ($ million) 4.4 Geography Segment Analysis 2017 - 2021 Exhibit 21: Historic Market Size – Geography Segment 2017 - 2021 ($ million) 4.5 Country Segment Analysis 2017 - 2021 Exhibit 22: Historic Market Size – Country Segment 2017 - 2021 ($ million) 5 Five Forces Analysis Exhibit 33: Data Table on Comparison by Product 6.3 Airborne LiDAR - Market size and forecast 2022-2027 Exhibit 34: Chart on Airborne LiDAR - Market size and forecast 2022-2027 ($ million) Exhibit 35: Data Table on Airborne LiDAR - Market size and forecast 2022-2027 ($ million) Exhibit 36: Chart on Airborne LiDAR - Year-over-year growth 2022-2027 (%) Exhibit 37: Data Table on Airborne LiDAR - Year-over-year growth 2022-2027 (%) 6.4 Terrestrial LiDAR - Market size and forecast 2022-2027 Exhibit 38: Chart on Terrestrial LiDAR - Market size and forecast 2022-2027 ($ million) Exhibit 39: Data Table on Terrestrial LiDAR - Market size and forecast 2022-2027 ($ million) Exhibit 40: Chart on Terrestrial LiDAR - Year-over-year growth 2022-2027 (%) Exhibit 41: Data Table on Terrestrial LiDAR - Year-over-year growth 2022-2027 (%) 6.5 Market opportunity by Product Exhibit 42: Market opportunity by Product ($ million) Exhibit 43: Data Table on Market opportunity by Product ($ million) 7 Market Segmentation by Application 7.1 Market segments Exhibit 47: Data Table on Comparison by Application 7.3 Corridor mapping - Market size and forecast 2022-2027 Exhibit 48: Chart on Corridor mapping - Market size and forecast 2022-2027 ($ million) Exhibit 49: Data Table on Corridor mapping - Market size and forecast 2022-2027 ($ million) Exhibit 50: Chart on Corridor mapping - Year-over-year growth 2022-2027 (%) Exhibit 51: Data Table on Corridor mapping - Year-over-year growth 2022-2027 (%) 7.4 Engineering - Market size and forecast 2022-2027 Exhibit 52: Chart on Engineering - Market size and forecast 2022-2027 ($ million) Exhibit 53: Data Table on Engineering - Market size and forecast 2022-2027 ($ million) Exhibit 54: Chart on Engineering - Year-over-year growth 2022-2027 (%) Exhibit 55: Data Table on Engineering - Year-over-year growth 2022-2027 (%) 7.5 ADAS and driverless cars - Market size and forecast 2022-2027 Exhibit 56: Chart on ADAS and driverless cars - Market size and forecast 2022-2027 ($ million) Exhibit 57: Data Table on ADAS and driverless cars - Market size and forecast 2022-2027 ($ million) Exhibit 58: Chart on ADAS and driverless cars - Year-over-year growth 2022-2027 (%) Exhibit 59: Data Table on ADAS and driverless cars - Year-over-year growth 2022-2027 (%) 7.6 Environment - Market size and forecast 2022-2027 Exhibit 60: Chart on Environment - Market size and forecast 2022-2027 ($ million) Exhibit 61: Data Table on Environment - Market size and forecast 2022-2027 ($ million) Exhibit 62: Chart on Environment - Year-over-year growth 2022-2027 (%) Exhibit 63: Data Table on Environment - Year-over-year growth 2022-2027 (%) 7.7 Others - Market size and forecast 2022-2027 Exhibit 64: Chart on Others - Market size and forecast 2022-2027 ($ million) Exhibit 65: Data Table on Others - Market size and forecast 2022-2027 ($ million) Exhibit 66: Chart on Others - Year-over-year growth 2022-2027 (%) Exhibit 67: Data Table on Others - Year-over-year growth 2022-2027 (%) 7.8 Market opportunity by Application Exhibit 68: Market opportunity by Application ($ million) Exhibit 69: Data Table on Market opportunity by Application ($ million) 8 Customer Landscape Exhibit 74: Data Table on Geographic comparison 9.3 North America - Market size and forecast 2022-2027 Exhibit 75: Chart on North America - Market size and forecast 2022-2027 ($ million) Exhibit 76: Data Table on North America - Market size and forecast 2022-2027 ($ million) Exhibit 77: Chart on North America - Year-over-year growth 2022-2027 (%) Exhibit 78: Data Table on North America - Year-over-year growth 2022-2027 (%) 9.4 Europe - Market size and forecast 2022-2027 Exhibit 79: Chart on Europe - Market size and forecast 2022-2027 ($ million) Exhibit 80: Data Table on Europe - Market size and forecast 2022-2027 ($ million) Exhibit 81: Chart on Europe - Year-over-year growth 2022-2027 (%) Exhibit 82: Data Table on Europe - Year-over-year growth 2022-2027 (%) 9.5 APAC - Market size and forecast 2022-2027 Exhibit 83: Chart on APAC - Market size and forecast 2022-2027 ($ million) Exhibit 84: Data Table on APAC - Market size and forecast 2022-2027 ($ million) Exhibit 85: Chart on APAC - Year-over-year growth 2022-2027 (%) Exhibit 86: Data Table on APAC - Year-over-year growth 2022-2027 (%) 9.6 Middle East and Africa - Market size and forecast 2022-2027 Exhibit 87: Chart on Middle East and Africa - Market size and forecast 2022-2027 ($ million) Exhibit 88: Data Table on Middle East and Africa - Market size and forecast 2022-2027 ($ million) Exhibit 89: Chart on Middle East and Africa - Year-over-year growth 2022-2027 (%) Exhibit 90: Data Table on Middle East and Africa - Year-over-year growth 2022-2027 (%) 9.7 South America - Market size and forecast 2022-2027 Exhibit 91: Chart on South America - Market size and forecast 2022-2027 ($ million) Exhibit 92: Data Table on South America - Market size and forecast 2022-2027 ($ million) Exhibit 93: Chart on South America - Year-over-year growth 2022-2027 (%) Exhibit 94: Data Table on South America - Year-over-year growth 2022-2027 (%) 9.8 US - Market size and forecast 2022-2027 Exhibit 95: Chart on US - Market size and forecast 2022-2027 ($ million) Exhibit 96: Data Table on US - Market size and forecast 2022-2027 ($ million) Exhibit 97: Chart on US - Year-over-year growth 2022-2027 (%) Exhibit 98: Data Table on US - Year-over-year growth 2022-2027 (%) 9.9 China - Market size and forecast 2022-2027 Exhibit 99: Chart on China - Market size and forecast 2022-2027 ($ million) Exhibit 100: Data Table on China - Market size and forecast 2022-2027 ($ million) Exhibit 101: Chart on China - Year-over-year growth 2022-2027 (%) Exhibit 102: Data Table on China - Year-over-year growth 2022-2027 (%) 9.10 Germany - Market size and forecast 2022-2027 Exhibit 103: Chart on Germany - Market size and forecast 2022-2027 ($ million) Exhibit 104: Data Table on Germany - Market size and forecast 2022-2027 ($ million) Exhibit 105: Chart on Germany - Year-over-year growth 2022-2027 (%) Exhibit 106: Data Table on Germany - Year-over-year growth 2022-2027 (%) 9.11 UK - Market size and forecast 2022-2027 Exhibit 107: Chart on UK - Market size and forecast 2022-2027 ($ million) Exhibit 108: Data Table on UK - Market size and forecast 2022-2027 ($ million) Exhibit 109: Chart on UK - Year-over-year growth 2022-2027 (%) Exhibit 110: Data Table on UK - Year-over-year growth 2022-2027 (%) 9.12 Japan - Market size and forecast 2022-2027 Exhibit 111: Chart on Japan - Market size and forecast 2022-2027 ($ million) Exhibit 112: Data Table on Japan - Market size and forecast 2022-2027 ($ million) Exhibit 113: Chart on Japan - Year-over-year growth 2022-2027 (%) Exhibit 114: Data Table on Japan - Year-over-year growth 2022-2027 (%) 9.13 Market opportunity by geography Exhibit 115: Market opportunity by geography ($ million) Exhibit 116: Data Tables on Market opportunity by geography ($ million) 10 Drivers, Challenges, and Trends 10.1 Market drivers About Us Technavio is a leading global technology research and advisory company. Their research and analysis focuses on emerging market trends and provides actionable insights to help businesses identify market opportunities and develop effective strategies to optimize their market positions. With over 500 specialized analysts, Technavio's report library consists of more than 17,000 reports and counting, covering 800 technologies, spanning across 50 countries. Their client base consists of enterprises of all sizes, including more than 100 Fortune 500 companies. This growing client base relies on Technavio's comprehensive coverage, extensive research, and actionable market insights to identify opportunities in existing and potential markets and assess their competitive positions within changing market scenarios. Contact
Quanergy Systems Frequently Asked Questions (FAQ)
When was Quanergy Systems founded?
Quanergy Systems was founded in 2012.
Where is Quanergy Systems's headquarters?
Quanergy Systems's headquarters is located at 433 Lakeside Drive, Sunnyvale.
What is Quanergy Systems's latest funding round?
Quanergy Systems's latest funding round is PIPE.
How much did Quanergy Systems raise?
Quanergy Systems raised a total of $183.76M.
Who are the investors of Quanergy Systems?
Investors of Quanergy Systems include Alisher Usmanov, CITIC Capital Acquisition, Paycheck Protection Program, Rising Tide, Motus Ventures and 16 more.
Who are Quanergy Systems's competitors?
Competitors of Quanergy Systems include Velodyne Lidar , aiMotive, Seoul Robotics, Blickfeld, Fantasmo and 16 more.
Compare Quanergy Systems to Competitors

Cruise Automation makes automated driving technology. Cruise has built a highway autopilot system that installs on existing vehicles. It uses sensors and machine vision technology to keep users in their lane and a safe distance from the car in front of them. The company was founded in 2013 and is based in San Francisco, California. On March 20th, 2022, General Motors acquired a majority stake in Cruise Automation at a valuation between $19B to $30B.

Nauto operates as a transportation technology company. The company offers an artificial intelligence-enabled fleet and driver safety platform that helps predict and prevent distracted driving. The company's intelligent vehicle hardware prevents collisions, improves driver behavior, and learns from the data shared across its network. It was founded in 2015 and is based in Palo Alto, California.

Comma.ai is a self-driving car company. Comma.ai has developed several products, including chffr, a dashcam phone app that enables drivers to act as teachers for autonomous cars, and Panda, a universal car interface that plugs into a car's OBD port to collect and record driving data.

WRLD is a dynamic 3D mapping platform to create digital twins for smart cities and buildings, gaming, AR/VR experiences, and more.
UISEE develops autonomous driving technology to commercialize driverless vehicles in a controlled environment. Its driving technology provides logistics solutions and future-oriented mobility by integrating artificial intelligence algorithms and advanced radars and sensors. The company was founded in 2016 and is based in Beijing, China.

Mapbox operates as a provider of custom online maps for websites and applications. It offers a developer blog, stock overflow, developer spotlight, and public code repositories. The products include matrix application programming interface (API), geocoding, navigation solution, dash, traffic data, and more. The primary clients are logistics, automotive, outdoors, retail, and more. It was founded in 2010 and is based in Washington, District of Columbia.
Discover the right solution for your team
The CB Insights tech market intelligence platform analyzes millions of data points on vendors, products, partnerships, and patents to help your team find their next technology solution.